Types of Blood Glucose Curves, Part 1
Over the years I ran many blood glucose curves on Lucy, I was lucky enough to have an AAHA accredited vet that encouraged home testing and running curves at home, I emailed the vet curve results and he reviewed and called me with suggested insulin changes. Stress can cause hyperglycemia and hypoglycemia in dogs, so it is recommended to run curves at home.
Running a blood glucose curve is an especially important part of successfully managing canine diabetes. After a curve is run, we can see how food and insulin are working, the highs and lows, how exercise and treats affect blood glucose levels. We have a clearer window into how we are managing blood glucose levels, and whether adjustments need to be made.
Running a curve is a simple process, especially if you are used to testing blood glucose levels. Typical curves start at AM fasting (before food and insulin) BG reading, then feed and give insulin. Test blood glucose levels every two hours until you reach PM fasting. You should have a minimum of seven readings, and voila, you have a completed curve!
This week I want to go over the different types of curves that we see.
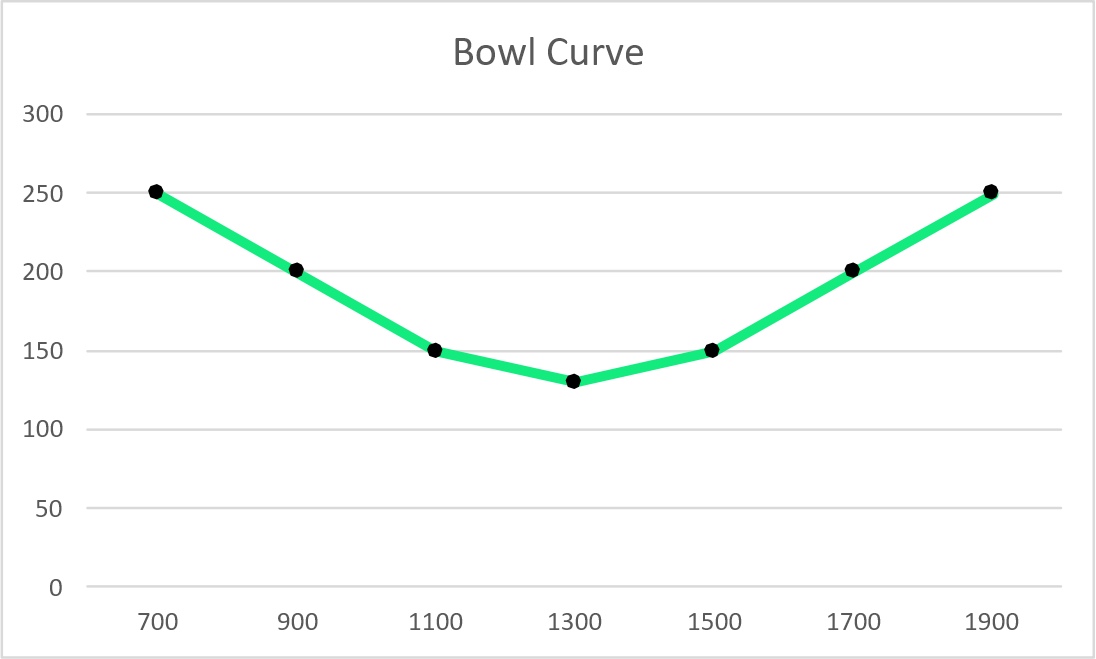
Bowl Curve – Fastings are the highest readings of the day. The nadir (lowest) blood glucose reading is midday, usually at peak of insulin.
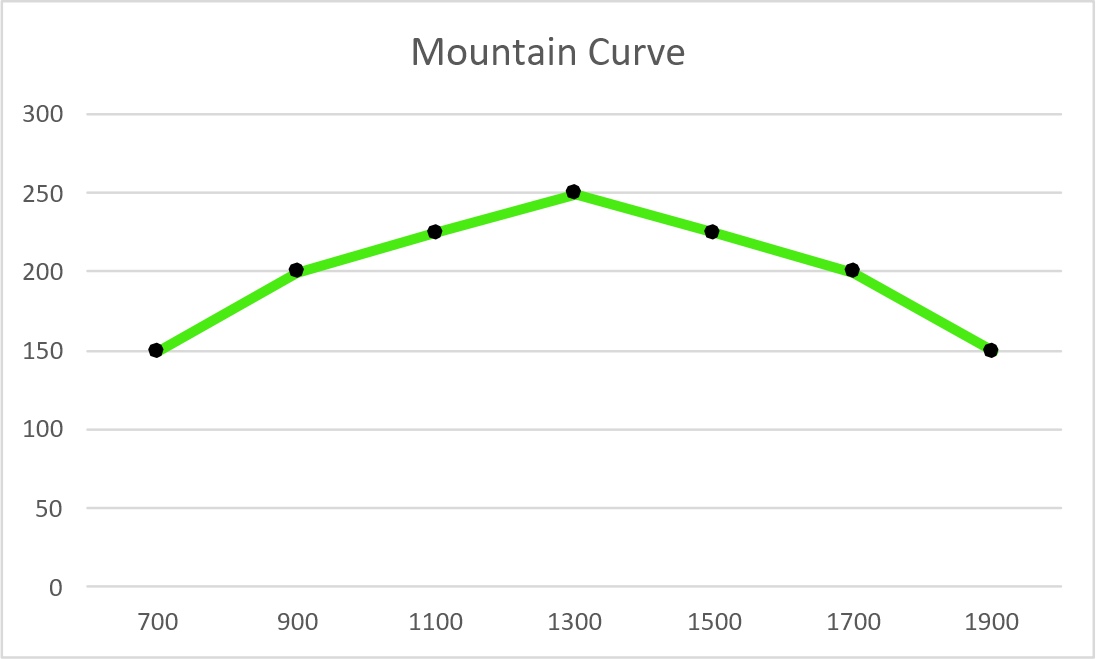
Mountain Curve – Fastings are the lowest readings of the day.
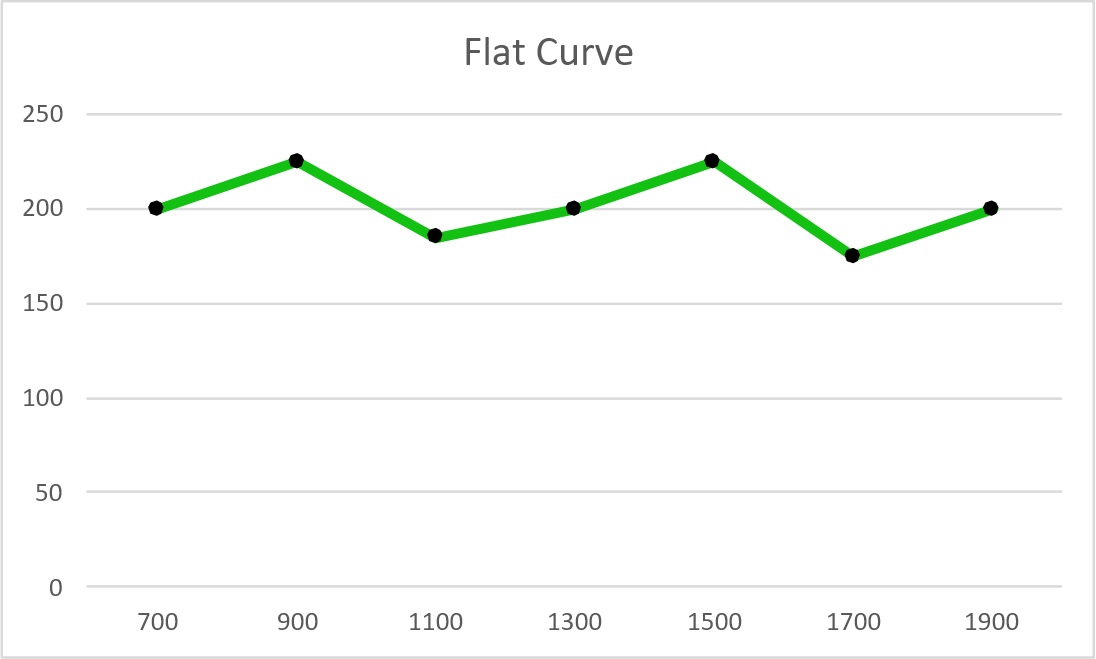
Flat Curve – Blood glucose levels are flat and even throughout the day.
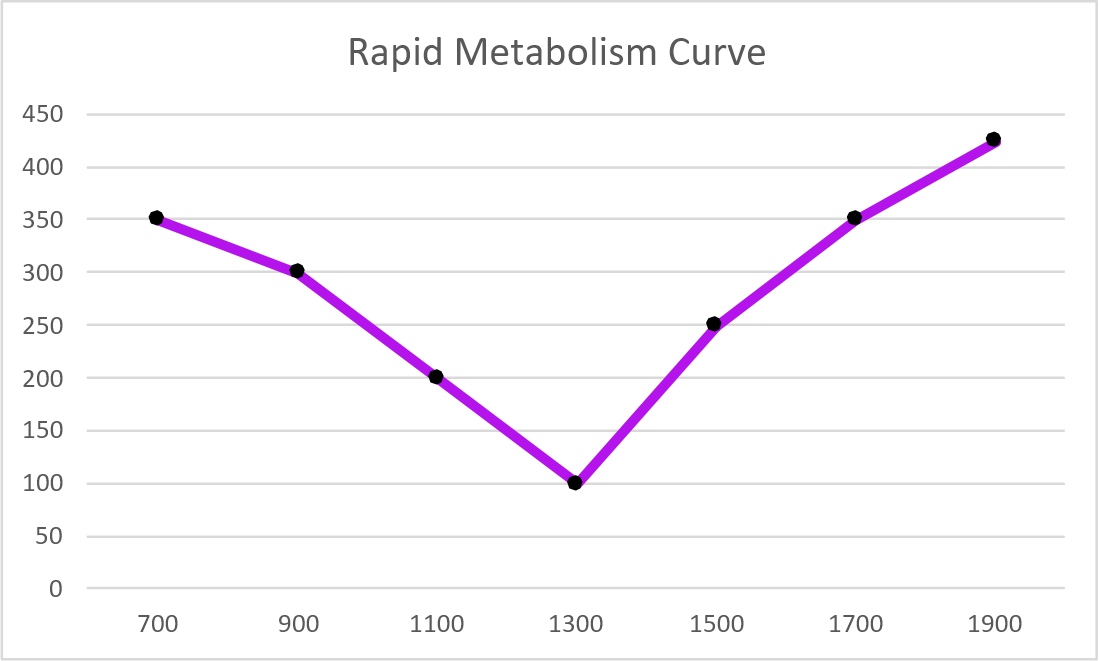
Rapid Metabolism Curve – Blood glucose levels are good for a several hours after insulin starts working. The nadir blood glucose is low and BG climbs steadily, due to the body metabolizing rapidly, insulin runs out too soon.
Somogyi Effect / Rebound Curves – Two types of curves are seen with Somogyi Effect / Rebound. The standard check mark curve where fasting BG is high BG drops during the curve, then shoots up to very high levels. This drop to lower levels causes the liver to go into emergency mode and dumps glucagon into the blood stream. The second type of Somogyi Effect / Rebound curve is a high and flat curve that resembles an insulin resistance curve. The liver is in emergency mode and continually dumping glucagon into the blood stream.

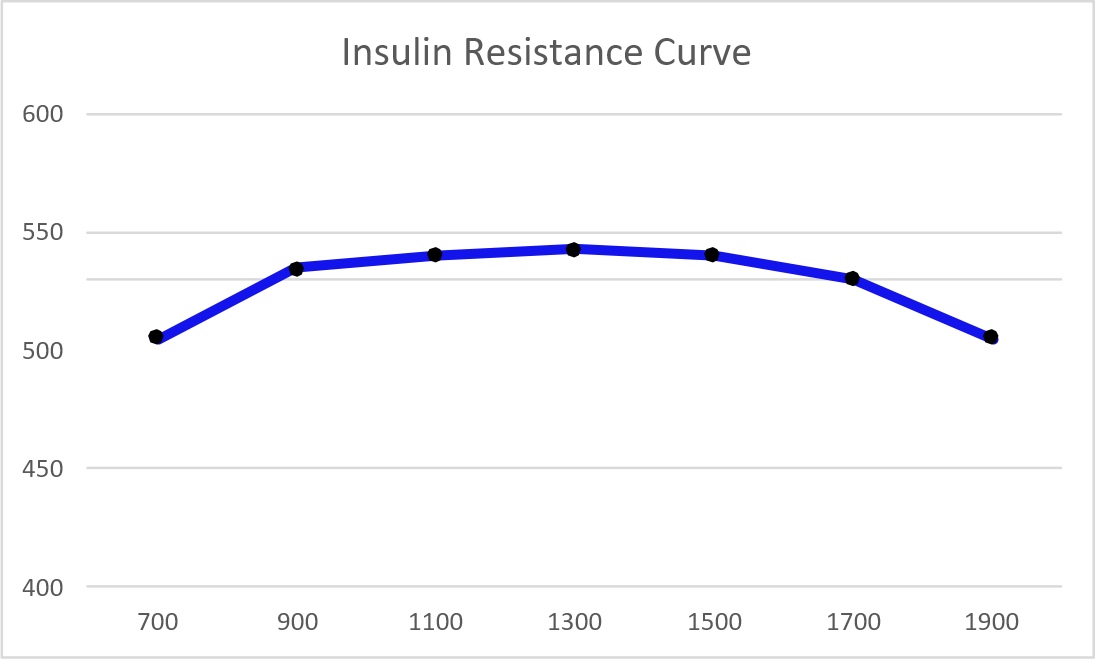
Insulin Resistance Curve – Blood glucose levels are high; insulin does not appear to have a lowering effect on glucose levels.
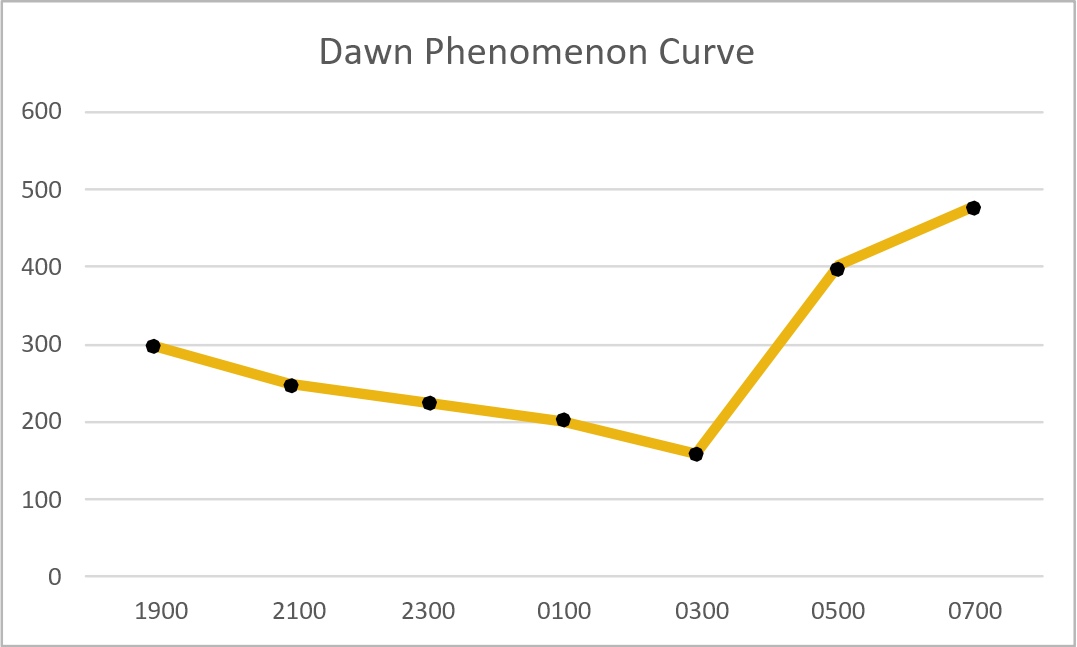
Dawn Phenomenon Curve – (from an overnight curve) blood glucose levels look good, like a bowl curve and then in the early morning hours BG shoots up due to increased cortisol levels. Cortisol causes insulin resistance.
I hope that this explanation of the different types of curves helps, next week I will in go into further detail and break down each curve.
Do you have any questions or comments? Have you run curves on your dog yet? Please start a conversation below!
Products you can purchase from PetTest to run curves:
PetTest Meter Kit - https://shoppettest.com/pettest-meter-kit/
PetTest Test Strips - https://shoppettest.com/pettest-strips-50-ct/
PetTest Safety Lancets - https://shoppettest.com/pettest-safety-lancets/
PetTest Twist Top Lancets - https://shoppettest.com/pettest-twist-top-lancets/
PetTest Genteel Painless Lancing Device - https://shoppettest.com/genteel-lancing-device/
If you are looking for a Facebook community to join for support, I have been an admin for Diabetic Dog Owners for four years. You can also join Canine Diabetes Support and Information on Facebook as well.
For more conversations, photos, and giveaways check out PetTest on Facebook and Instagram.

