Types of Blood Glucose Curves: Part 2
Successfully managing canine diabetes can take work, many times we need to change food to something lower in carbohydrates and fat. We also need to ensure that blood glucose levels are lower to help the organs. The liver produces glucose from digested food, the kidneys filter blood and when blood glucose levels hit 180 mg/dL (10 mmol/L) they dump glucose into the bladder. Eyes are affected by excess glucose levels as well, the lens of the eyes have an enzyme in them that converts glucose into sorbitol, this collection of sorbitol affects proteins and cells, causing cataracts. High blood glucose can damage the blood vessels and nerves that control the heart. So it is especially important to get blood glucose levels to a target range of 100 – 250 mg/dL or 5.5 – 13.8 mmol/L.
As mentioned in past blogs, running a blood glucose curve is simple. You need to have at least 12 hours to dedicate to running a curve, the tools to do it, and a little knowledge can go a long way. We are asked often, “What does this curve tell me, I don’t understand it!” so today I want to break down the types of curves that I wrote about last week along with suggestions as to what these curves tell us and what we can or should do.
Very important note to remember! You always need to look at the lowest reading, or “nadir” in a curve. This tells us whether it is safe to increase insulin. Since we go by the rule of thumb that 1 unit of intermediate acting insulin has the potential to drop blood glucose levels by up to 100 points, we could not increase insulin if the lowest reading was 100. Even if you have an extremely high reading, 500 mg/dL (27.7 mmol/L) but a low of 120 you would not be able to safely increase insulin because of that low blood glucose reading.
Bowl Curve – Fastings are the highest readings of the day. The nadir (lowest) blood glucose reading is midday, usually at peak of insulin.
Food and insulin are working well together, insulin is kicking in before food, so there is no food spike.
Insulin can be increased if the lowest reading is 150 mg/dL (8.3 mmol/L).

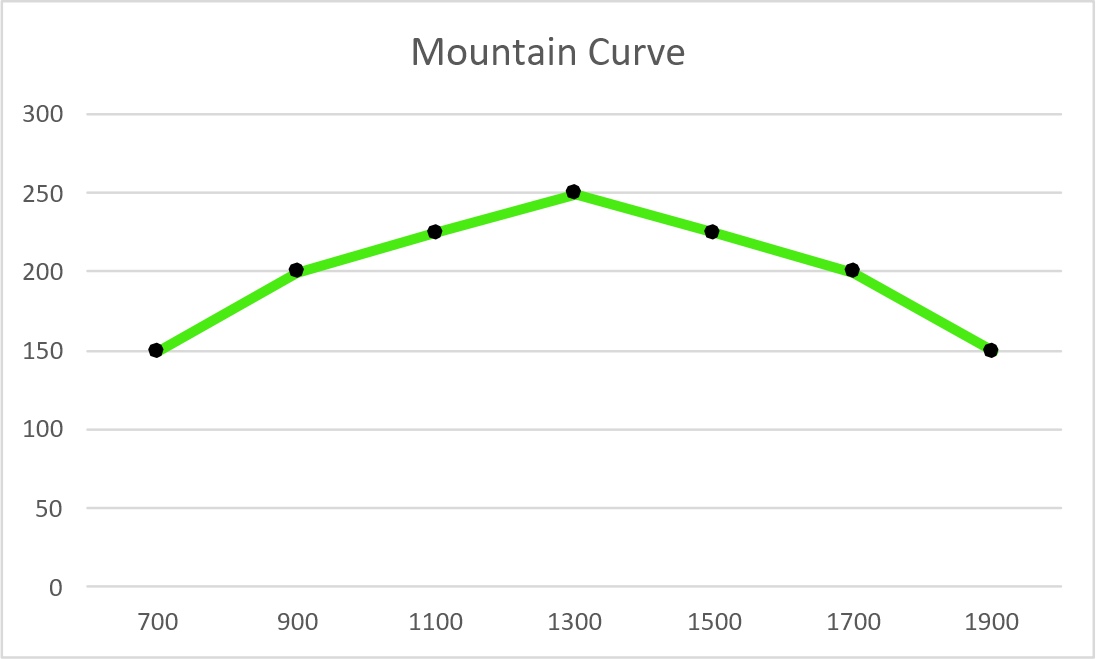
Mountain Curve – Fastings are the lowest readings of the day.
Insulin and food are working together, just a reverse of the bowl curve.
Insulin can be increased if the lowest reading is 150 mg/dL (8.3 mmol/L).

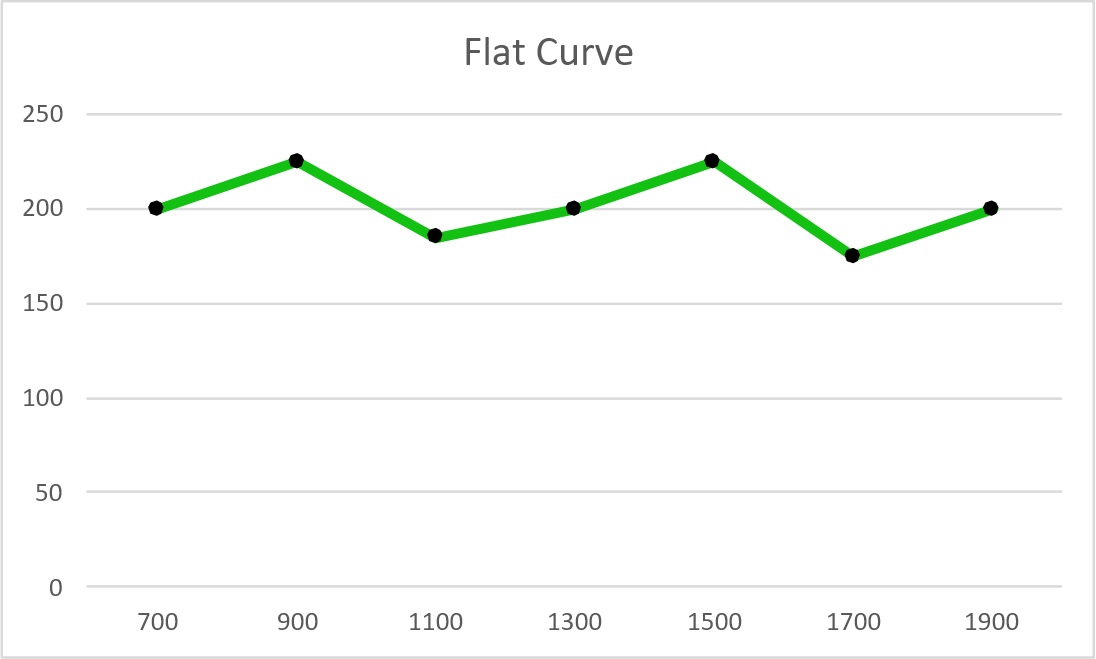
Flat Curve – Blood glucose levels are flat and even throughout the day.
Insulin and food are working very well together, there are no food spikes or major drops in blood glucose levels.
Insulin can be increased if the lowest reading is 150 mg/dL (8.3 mmol/L).

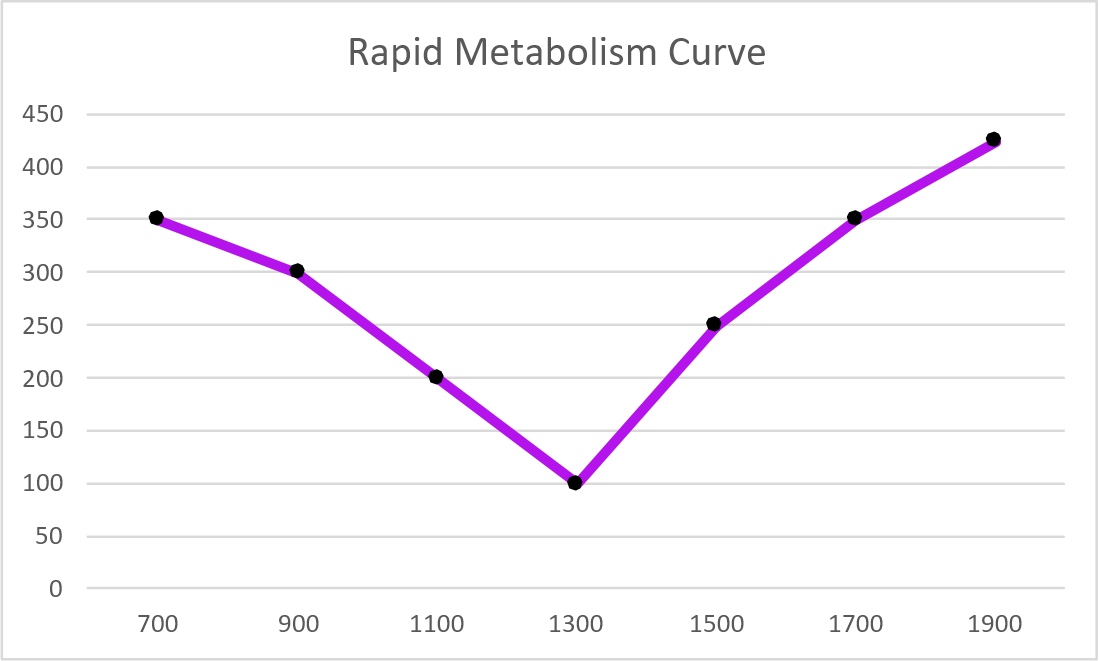
Rapid Metabolism Curve – Blood glucose levels are good for a several hours after insulin starts working. The nadir blood glucose is low and BG climbs steadily, due to the body metabolizing rapidly, insulin runs out too soon.
For a dog with rapid metabolism a long-acting insulin can be recommended. There are also caregivers that inject closer to the scruff to slow down absorption of insulin.

Somogyi Effect / Rebound Curves – Two types of curves are seen with Somogyi Effect / Rebound. The standard check mark curve where fasting BG is high BG drops during the curve, then shoots up to very high levels. This drop to lower levels causes the liver to go into emergency mode and dumps glucagon into the blood stream. The second type of Somogyi Effect / Rebound curve is a high and flat curve that resembles an insulin resistance curve. The liver is in emergency mode and continually dumping glucose into the blood stream.
To rule out Somogyi Effect / Rebound it is recommended to reduce insulin by at least 25%, after six full doses of the reduced insulin another curve should be run to see where BG levels are, and if Somogyi Effect / Rebound has been broken.

Insulin Resistance Curve - Blood glucose levels are high; insulin does not appear to have a lowering effect on glucose levels.
Dogs with insulin resistance need to be tested for underlying health issues that are causing this for example: Cushing’s Disease, hypothyroidism, female dogs in heat. Once the health issues that are causing insulin resistance are managed, blood glucose levels should be easier to control.

Dawn Phenomenon Curve – blood glucose levels look good, like a bowl curve and then in the early morning hours BG shoots up due to increased cortisol levels. Cortisol causes insulin resistance.
A curve must be run overnight to diagnose Dawn Phenomenon. Blood glucose levels will increase drastically between 3 – 5 am.
PM dose of insulin can be increased if the lowest reading is 150 mg/dL (8.3 mmol/L).

I hope that this breakdown of the different types of curves we can see with out diabetic dogs has helped clear up any confusion that these different graphs can cause. I know that it took me quite some time to understand the different types of blood glucose curves, what they mean, and what appropriate actions to take. If you have questions or comments, I would love to talk with you further about this, please post a comment below!
Please remember that this information is for educational purposes only and it is always recommended to work with your vet to dial in the proper dosage of insulin.
Products you can purchase from PetTest to run curves:
PetTest Meter Kit - https://shoppettest.com/pettest-meter-kit/
PetTest Test Strips - https://shoppettest.com/pettest-strips-50-ct/
PetTest Safety Lancets - https://shoppettest.com/pettest-safety-lancets/
PetTest Twist Top Lancets - https://shoppettest.com/pettest-twist-top-lancets/
PetTest Genteel Painless Lancing Device - https://shoppettest.com/genteel-lancing-device/
If you are looking for a Facebook community to join for support, I have been an admin for Diabetic Dog Owners for four years. You can also join Canine Diabetes Support and Information on Facebook as well.
For more conversations, photos, and giveaways check out PetTest on Facebook and Instagram.

